Application Diagrams
An Application diagram answers the question every reviewer asks first: what is inside this application, and what data does it touch?
Pick an application and ArchRepo draws everything it is made of and connected to, stacked in bands by kind — its user roles, its user interface, its APIs, the data it moves through and stores, and the services behind it.
What the Diagram Shows
The application you chose sits at the top as a title. Below it, ArchRepo stacks a band for each kind of thing the application is related to. A band only appears when the application has something in it — an application with no APIs recorded has no APIs band.
The six possible bands, in the order they can appear, are:
- Application Roles — who uses this application, and at what access level.
- UI Components — the screens, sections and widgets the application contains directly.
- APIs — the APIs the application uses.
- Streams/Message Queues — the streams and message queues the application uses.
- Backend Services — the backend services the application uses.
- Data Stores — the data the application reads or writes, grouped by the Data Store that holds it (or ungrouped, when a Data Set has no Data Store recorded for it).
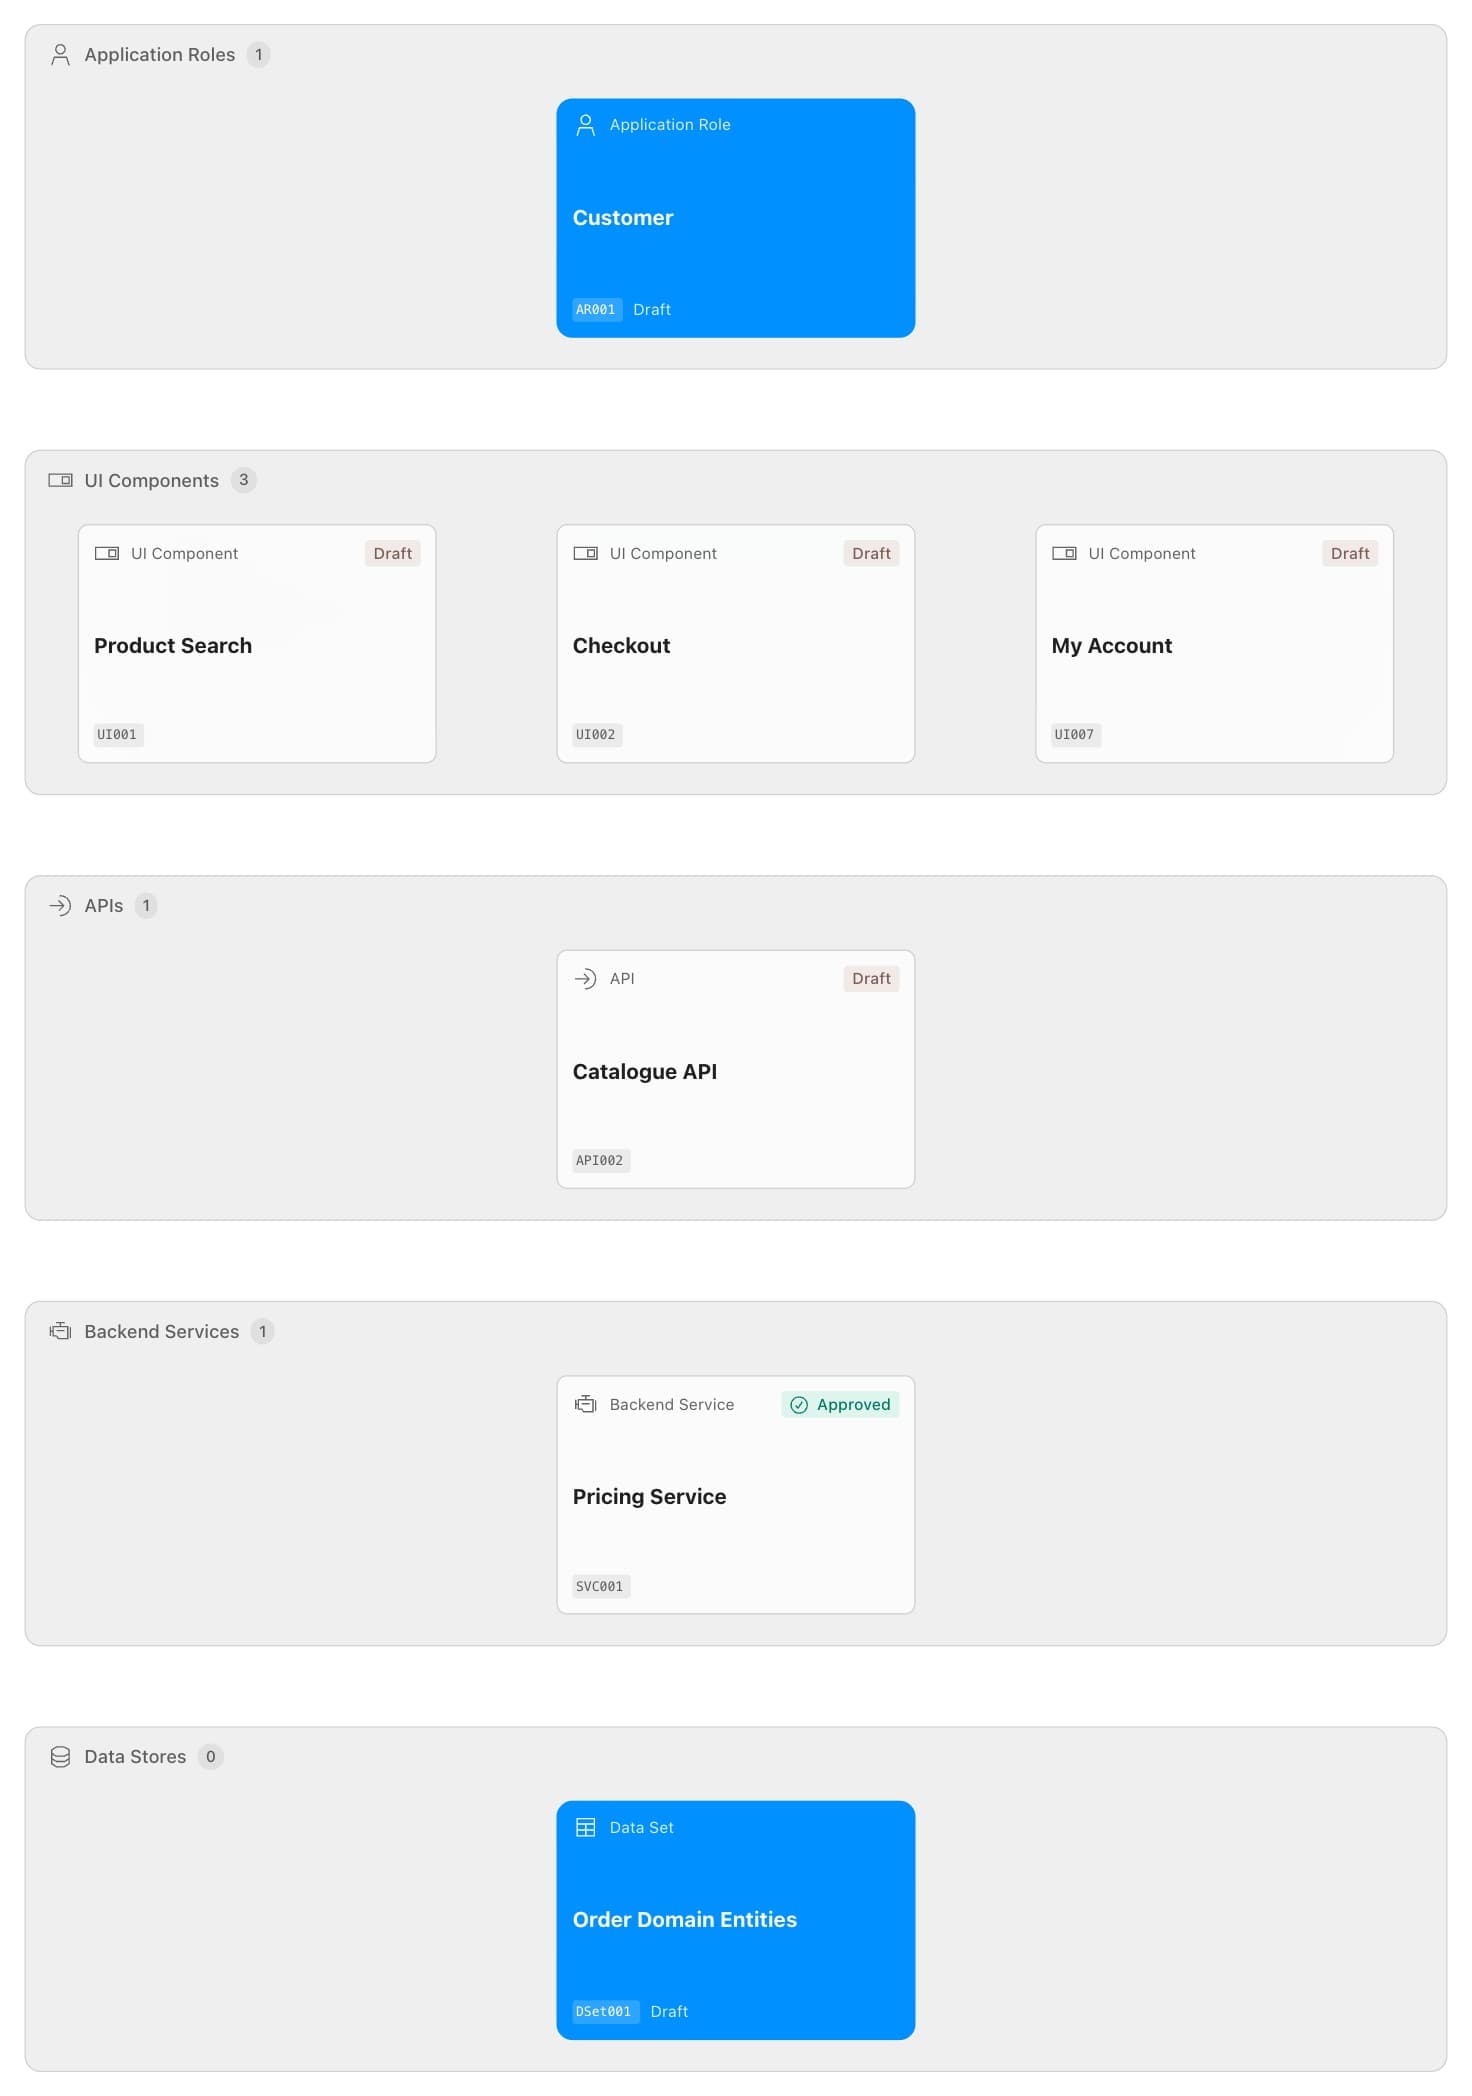
This diagram is read-only and draws no lines at all. Every relationship is shown as a band a card sits in, or as a colour — never as a line between cards. You change the picture by changing the model behind it.
The Read / Write / Admin Colours
Application Role cards and Data Set cards are filled, and entity chips at the Entities level are tinted, by the level of access the focal application’s relationship carries:
| Colour | Meaning here |
|---|---|
| Read | Read-only access. |
| Write | Can create and update. |
| Admin | Full rights, including delete (Application Roles only — a Data Set or entity is only ever Read or Write here). |
These colours describe data access, not a person’s permissions inside the application — the same three relationship types are also used to record an Application Role’s permission tier over an application, and the User Interaction Context diagram labels those with different names (Read-Only / Create/Update / Full Rights). Read the colour by which diagram you are looking at.
This is a colour key, not an edge legend. The Application diagram draws no edges at all — nothing is ever connected by a line. The swatch beside the toolbar tells you what a card’s fill or a chip’s tint means, nothing about a connection.
The Data Sets ↔ Entities Toggle
Once you have chosen a focal application, the Data Stores band can show its data at either of two levels of detail:
- Data sets — one card per Data Set the application reads or writes.
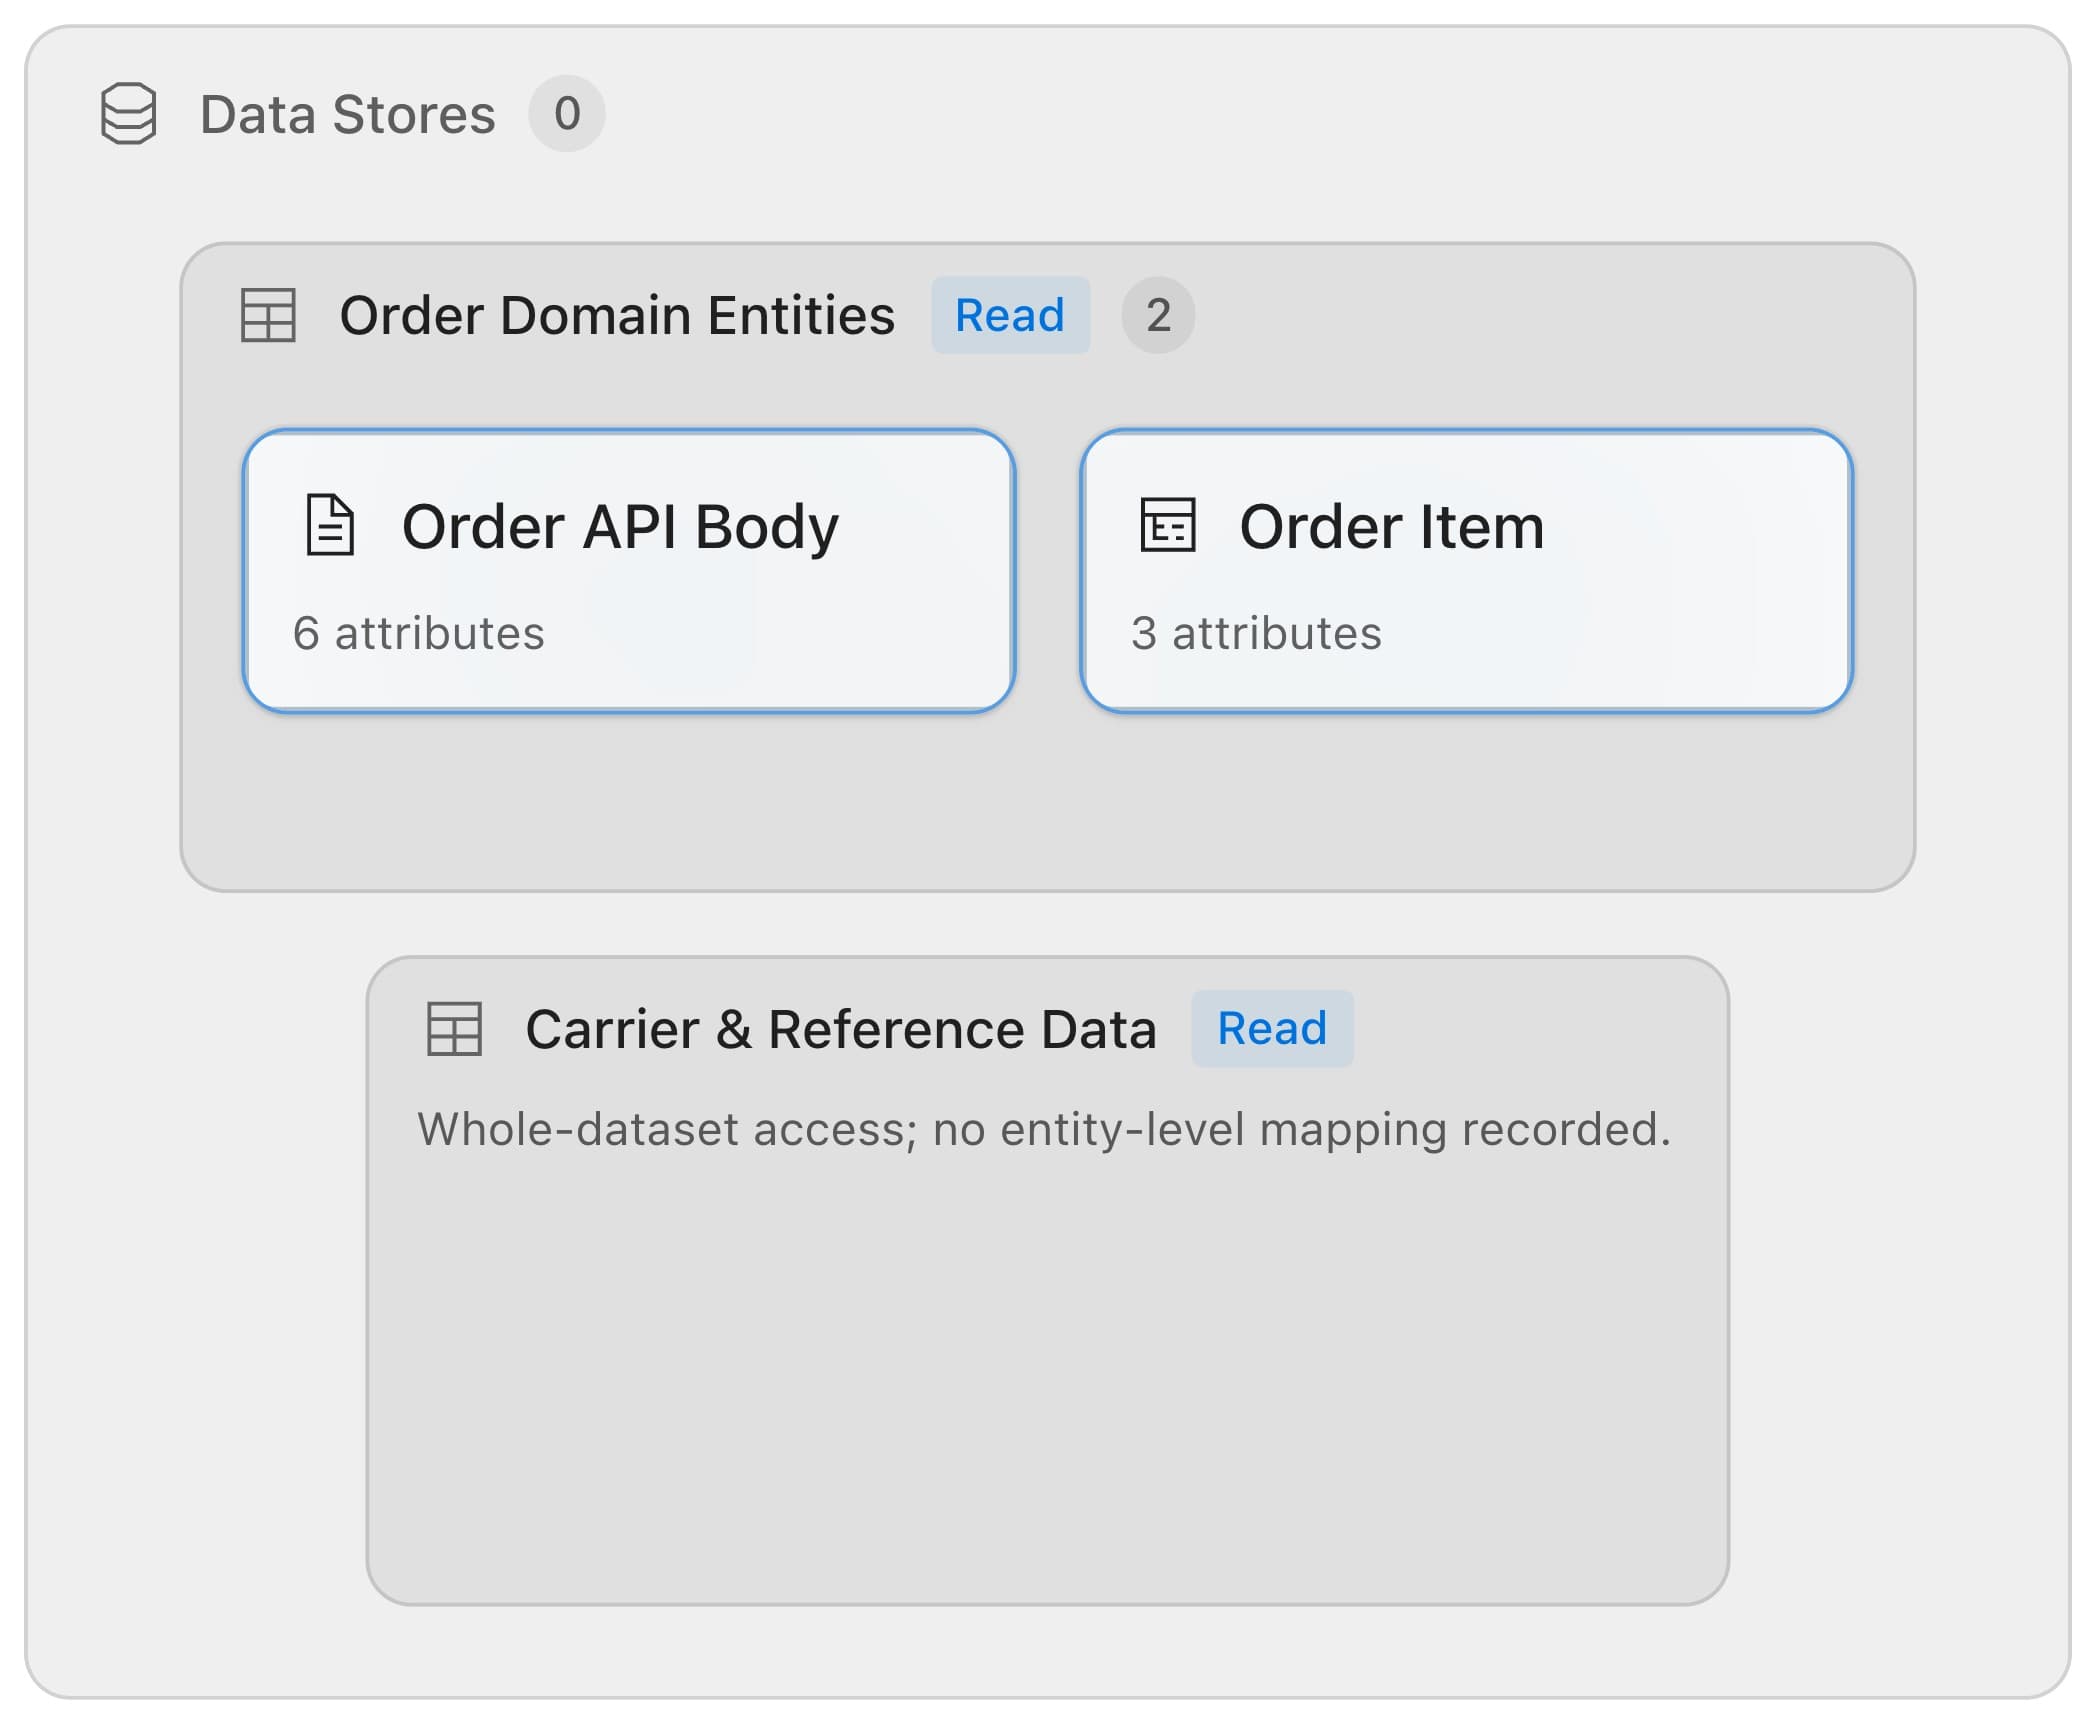
- Entities — the individual entities inside each Data Set that the application actually maps, grouped in a box per Data Set.
ArchRepo picks a starting level for you, based on how many entities the application maps across all its Data Sets:
| Mapped entities | Starting level |
|---|---|
| 1 to 12 | Entities |
| 13 or more | Data sets |
| None at all | Data sets |
You can always switch levels yourself with the toggle beside the application selector — the automatic choice is only a starting point. Nothing you have recorded is affected by which level you are looking at.
The Entities level is built from Data Use & Mapping rows, not from relationships. Recording that an application reads or writes a whole Data Set is not enough to populate it entity by entity — see Getting Data onto the Diagram in the Data Lineage guide for how to record the rows that do.
The Per-Data-Set Entity Cap
At the Entities level, each Data Set box shows at most 6 entity chips before it needs to offer more:
- 6 or fewer mapped entities — every one is shown, with no button.
- 7 or more mapped entities — the first 6 are shown, with a Show all (+N) button beneath them. N is the number still hidden, not the Data Set’s total — a Data Set mapping 9 entities shows 6 and reads Show all (+3). Selecting it shows every entity and the button becomes Show fewer, which collapses it back to 6.
- Whole-dataset access, nothing entity-level — a Data Set the application reads or writes as a whole, with no Data Use & Mapping rows recorded against it, shows no chips and no button at all. Instead its box reads “Whole-dataset access; no entity-level mapping recorded.” — visible in the screenshot above, on Carrier & Reference Data.
Controls
- Application selector — on the project’s Diagrams tab, choose which application to show.
- Status filter — narrow the diagram to only the statuses you choose. Everything else on this page, including whether the diagram counts as empty, is worked out from the filtered set.
- Data sets ↔ Entities toggle — appears once a focal application’s data mapping has loaded. See above.
- Show all / Show fewer — appears on any Data Set box at the Entities level with more mapped entities than the cap shows. See above.
- View data mapping — beside the application’s title, opens the Data Mapping diagram for this application as a whole. See Drilling Into Data Mapping below.
Where to Find It
Across the project — the project’s Diagrams tab, then Application in the switcher. Choose an application.
From the User Interaction Context diagram — selecting an application card opens this diagram already focused on it. This is usually how you arrive here: you find the application you care about on the wider picture, then drill in to see what it is made of.
Drilling Into Data Mapping
Two different buttons take you from here to the Data Mapping diagram, at two different scopes:
- View data mapping, beside the application’s title, opens Data Mapping for the whole application — every entity it reads, writes or transforms.
- The ƒ badge on an entity chip, at the Entities level, appears only on an entity a transformation writes to. Selecting it opens Data Mapping already focused on that one transformation, rather than the whole application.
When the Diagram Is Empty
| What you see | What it means |
|---|---|
| ”Choose an application above to see its layered view.” | No application selected yet. |
| ”This application no longer exists, or belongs to a different project.” | The application the page address points at cannot be found here. |
| ”This item is not an application, so it cannot be shown in this diagram.” | The page address points at an item that is not an application. Choose one in the selector. |
| ”Failed to load this item’s data mapping.” | The application’s data mapping could not be retrieved. Reload the page. |
| ”This application has no related items.” | The application has nothing to draw at all, or the Status filter excludes everything it has — see below. |
| ”Failed to load the Application diagram.” | The diagram’s own data could not be retrieved at all — a different, earlier failure than the data mapping one above. Reload the page. |
Why Is My Diagram Empty?
The diagram is built from what is recorded in the model. For a band to appear:
- The item itself must exist — an
applicationitem, recorded and active. - It must be related to something in each band you expect — an Application Role with access to it, UI Components it contains, and APIs, Streams/Message Queues or Backend Services it uses.
- For the Entities level, it needs Data Use & Mapping rows — a relationship to a whole Data Set is not enough; record what it reads and writes entity by entity, as described above.
A Status filter that matches nothing looks exactly like an empty model. “This application has no related items” is shown whenever the filtered set is empty — whether that is because nothing was ever recorded, or because your chosen statuses happen to exclude everything this application has. If a diagram you expect to be populated looks empty, clear the Status filter before you go looking for a modelling gap.
Why It Is Useful
A single-screen summary of an application. Everything it is made of and everything it touches, without opening each related item one at a time.
Spotting what an application is missing. No Application Roles band means nobody has recorded who can use it. No Data Stores band means nobody has recorded what data it touches — both are gaps worth closing, not just gaps in the picture.
A starting point for deeper questions. From here, drill into the UI Components diagram for the application’s whole front end, or into Data Mapping for exactly how it uses one piece of data.