Data Mapping Diagrams
A Data Mapping diagram answers a question Data Lineage deliberately leaves out: for one specification, exactly how is each field built — copied straight across, looked up, split, merged, held constant, or generated at run time?
Where Data Lineage traces data at the level of whole entities, Data Mapping goes one level deeper, to the individual attribute. It is the most detailed thing ArchRepo’s model holds, and this diagram is what makes that detail readable.
What the Diagram Shows
Every Data Mapping diagram is built around one transformation — a named unit of work that reads from some entities and writes to others. A transformation has three entity-level roles:
| Role | Meaning |
|---|---|
| Sources | Entities the transformation reads from. |
| Targets | Entities the transformation writes to. |
| Reference data | Tables consulted along the way, without being the thing being transformed. |
These three roles are exactly what Data Lineage itself needs — see Getting Data onto the Diagram for how they are recorded. Data Mapping is what sits underneath them: once Sources, Targets and Reference data are chosen, this diagram lets you say, attribute by attribute, how each target field is actually produced.
Two View Modes
A Single / All toggle switches between two ways of looking at an item’s transformations:
- Single shows one transformation at a time, laid out as a diagram — the entities on one side, the target on the other, with a connecting line for every attribute mapping.
- All shows every transformation the item has, as a table: each row names the transformation and its Sources, Reference data, Target and how much of it is mapped, with a link that switches straight to that transformation in Single mode. If the item also has plain read/write data uses that never became a transformation, those are listed underneath.
The Eight Mapping Actions
In Single mode, every line between a source attribute and a target attribute carries one of eight actions:
| Action | Meaning |
|---|---|
| Copy | Carried across unchanged. |
| Transform | Rewritten by logic. |
| Lookup | Resolved via reference data. |
| Split | One value feeds several targets. |
| Merge | Several values combine into one. |
| Constant | A fixed literal value. |
| Generate | Produced by a rule at run time. |
| Ignore | Deliberately not mapped. |
Constant and Generate are the two actions with no source line at all — a target attribute can carry a fixed value or a run-time rule instead of being fed from anything upstream.
Where to Find It, and What You Can Do There
Data Mapping appears in two places, and both let a project editor change an existing transformation’s attribute mappings — but only one lets you create a transformation in the first place.
| Project Diagrams tab | Model item’s Data Mapping tab | |
|---|---|---|
| Focal item | Chosen from a selector, across every eligible item in the project | Pinned to the item you are viewing |
| Editing | A project editor can edit an existing transformation’s attribute mappings, row by row | A project editor can do the same, plus create, rename and delete transformations |
| Single mode | The diagram | The diagram, plus the attribute mapping grid beside it |
| All mode | The transformation index | The transformation index, plus the New Transformation control |
The model item tab has no edit-mode toggle to find first. Unlike the Specification tab, a project editor lands directly in an editable Data Mapping tab — there is nothing to switch on.
Across the project — the project’s Diagrams tab, then Data Mapping in the switcher. Choose any eligible item from the selector to see its transformations. A project editor can edit the mappings of a transformation that already exists here, exactly as they can from the model item tab — but there is no New Transformation control or transformation-management dialog on this route, so a brand new transformation is always created from the item’s own tab.
On a single item — the Data Mapping tab on any API, Application, Backend Service, Data Flow, Data Migration, Report or UI Component. This is where transformations are actually created: choose New Transformation, name it, and pick its Sources, Targets and Reference data — then, in Single mode, draw a line from a source attribute to a target attribute and choose the action it should carry. New Transformation sits in the tab header regardless of which view mode you are in.
Controls
- Focal item selector — project Diagrams tab only. Choose which item’s transformations to look at.
- Single / All toggle — switches between one transformation and the full index, on both homes.
- Transformation picker — when an item has more than one transformation, Single mode needs a way to choose between them. On the project Diagrams tab this is a dropdown beside the toggle, shown only when the item has more than one transformation. On the model item tab the same choice is made from the transformation card’s own title instead — there is no separate dropdown there.
Why It Is Useful
Precision Data Lineage can’t give you on its own. Knowing that a service reads the Order entity and writes the Invoice entity tells you the two are connected. It doesn’t tell you whether the invoice total is copied straight from the order, recalculated, or looked up from a pricing table — and that distinction is often exactly what a reviewer, an auditor, or the next developer needs.
A single place to see every attribute a transformation touches. Rather than reading source code or asking whoever built it, the mapping is recorded once, on the model, and read back as a diagram.
Finding what nobody has actually decided yet. An unmapped target attribute, or a source attribute with nowhere to go, shows up as a gap in the diagram rather than a silent omission in a document.
Like every diagram on the Diagrams tab, this is drawn from the model each time you open it — never a stored copy that can drift.
How Data Mapping Relates to Data Lineage
The two diagrams are built from the same underlying rows, but they answer different questions and — importantly — they don’t list the same items:
- The Data Mapping selector lists items that have at least one mapping row playing a transformation role — a source, a target or a lookup.
- The Data Lineage selector lists items that have at least one mapping row naming a data entity at all, whether or not it belongs to a transformation.
An item can therefore appear in one selector and not the other. A specification with plain read/write data uses — recorded but never grouped into a transformation — is traceable in Data Lineage but has nothing to show in Data Mapping. This is the single most confusing thing about the pair, so it is worth remembering: if an item you expect to see is missing from one selector, check whether it actually has a transformation, not just a data use.
When the Diagram Is Empty
Both homes share one message for “this item has no data mapping at all”:
This item has no data mapping yet. Add entries to its Data Mapping to see entities and transformations here.
This is shown in both Single and All mode whenever the item genuinely has no entities to derive a diagram from — see Why Is My Diagram Empty? below for a case that catches people out.
Beyond that shared message, each home has its own copy for its own states.
Project Diagrams Tab
| What you see | What it means |
|---|---|
| ”Choose an item above to see its data mapping.” | No item selected yet. |
| ”This item has no data mapping transformation…” | The item named in the page address doesn’t qualify as a Data Mapping focal point (no mapping row with a source, target or lookup role), so it can’t be resolved. |
| ”This item has no transformations to focus on.” | Single mode is active but the item has no transformations at all — switch to All, or pick a different item. |
| ”Failed to load this item’s data mapping.” | The per-item fetch failed after an item was chosen. |
| ”Failed to load the Data Mapping diagram.” | The focal-item list itself failed to load, so the selector is unusable — different from the per-item failure above. |
Model Item’s Data Mapping Tab
| What you see | What it means |
|---|---|
| ”This item has no transformations yet.” | Single mode is active but nothing has been created. In edit mode this is followed by a pointer to New Transformation. |
| ”Couldn’t refresh this view — reload the page to see the latest changes.” | A save happened but the view failed to refresh afterwards — reload the page to see it. |
| ”Failed to load this item’s data mapping.” | The initial load failed. |
Why Is My Diagram Empty?
The diagram can only show what has actually been modelled. The usual path to a populated Data Mapping diagram is:
- On a
useDataMappingitem — an API, Application, Backend Service, Data Flow, Data Migration, Report or UI Component — open the Data Mapping tab and choose New Transformation. - Give it a name, then choose its Sources, Targets and any Reference data — the entities it reads from and writes to.
- Switch to Single mode and draw the attribute-level mappings: connect a source attribute to a target attribute and choose the action (Copy, Transform, Lookup, Split, Merge, Constant, Generate or Ignore).
An item can have Data Mapping rows and still show the empty state. The empty state is decided by whether the diagram can derive any entities at all from what’s recorded — not by whether any mapping rows exist. A row that names a transformation and a role but never resolves to an actual entity is exactly this case. If a diagram you expect to be populated is showing the empty message, check that the transformation’s Sources, Targets and Reference data are genuinely set to real entities, not just that a transformation exists.
Screenshots
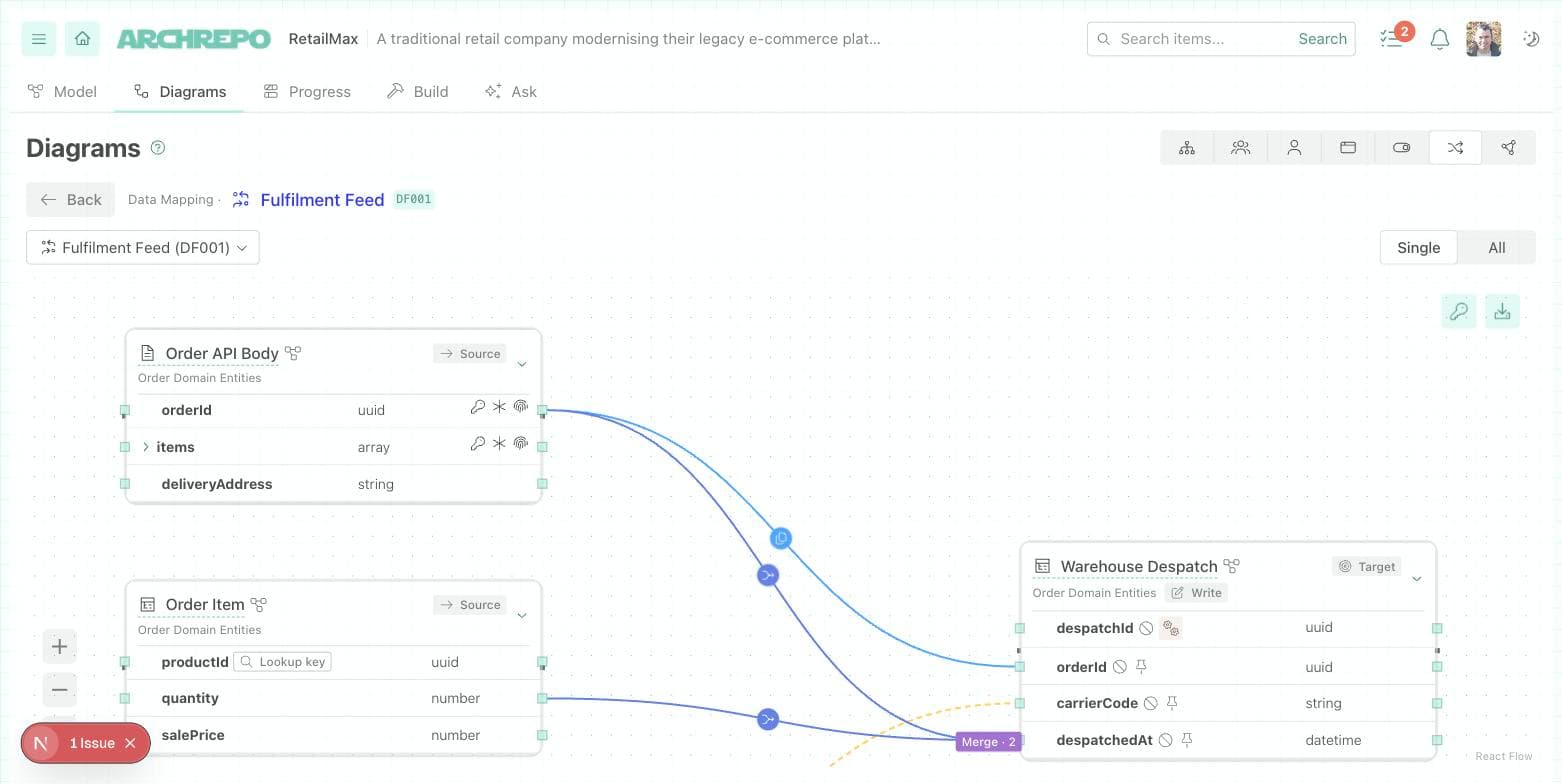
Project Diagrams tab — Single mode. A project editor can edit an existing transformation’s mappings here too, just with no New Transformation control.
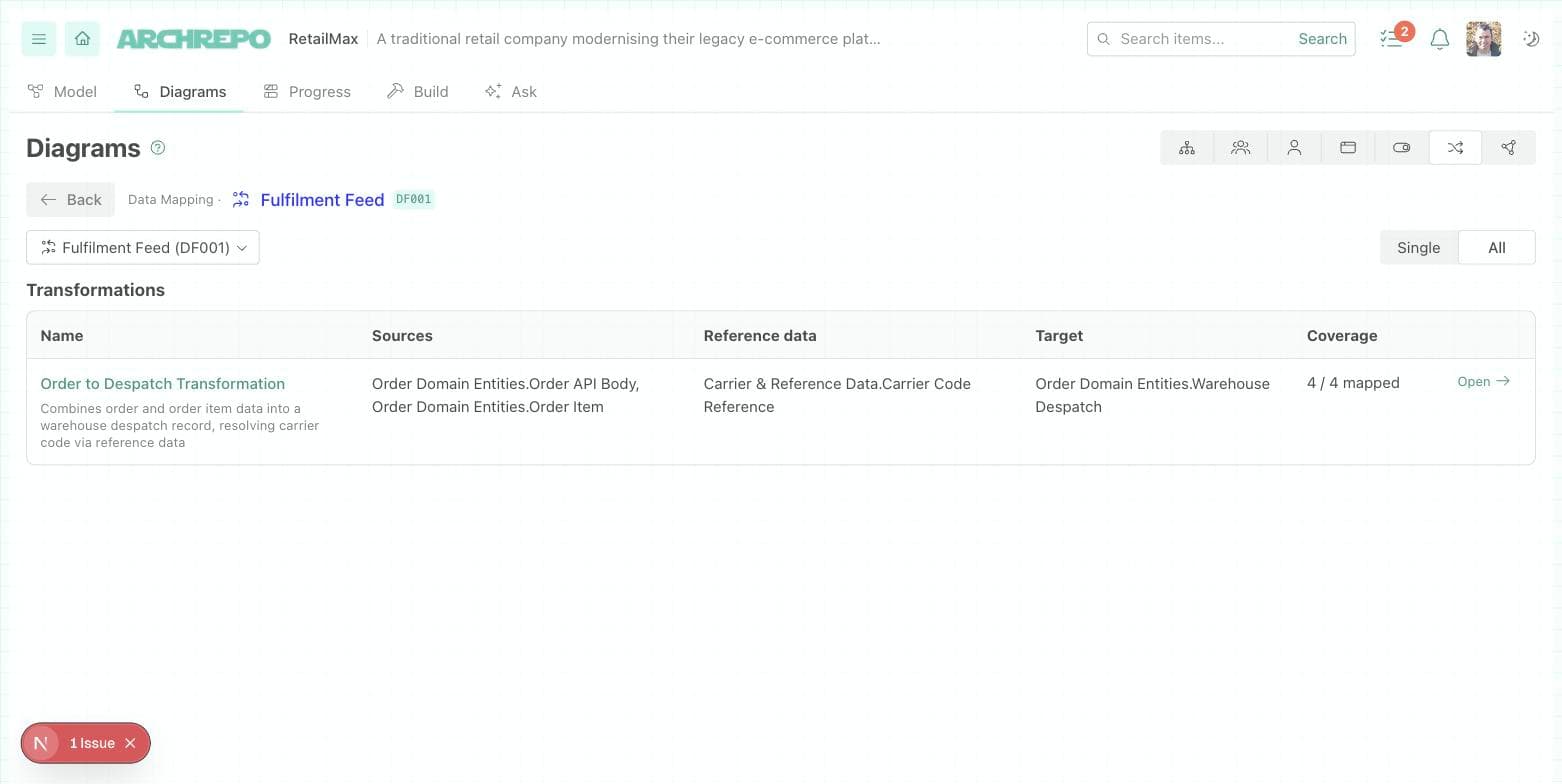
Project Diagrams tab — All mode: the transformation index.
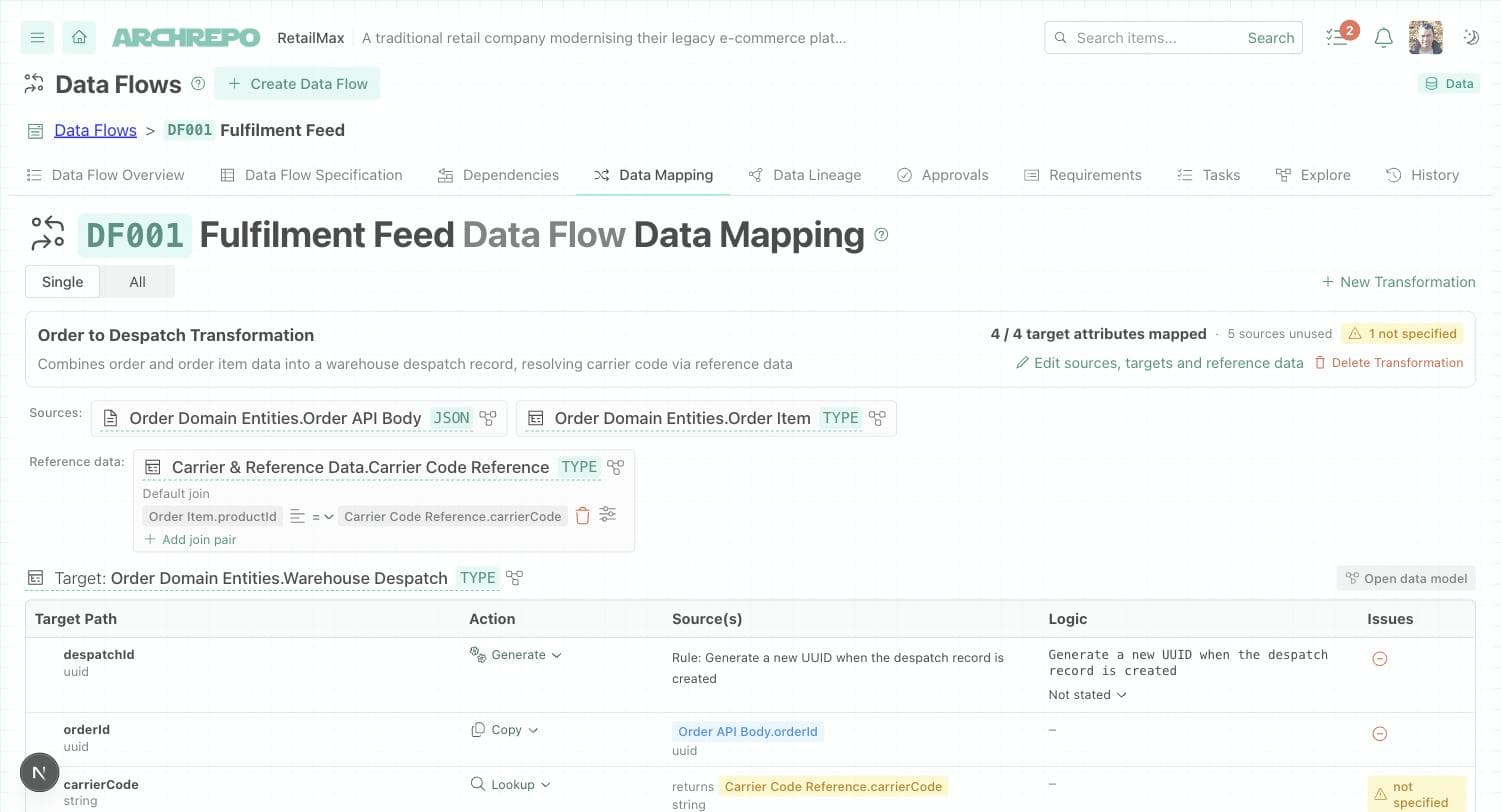
Model item’s own Data Mapping tab — Single mode, editable, with New Transformation.